
Google Analytics 4 changed everything about how we track website data. The old Universal Analytics interface is gone, and many website owners feel lost trying to figure out which reports actually matter.
You’re not alone if you’ve logged into GA4 and felt overwhelmed by the sheer number of reports available. The interface looks different, the metrics have changed, and finding the data you need feels like searching for a needle in a haystack.
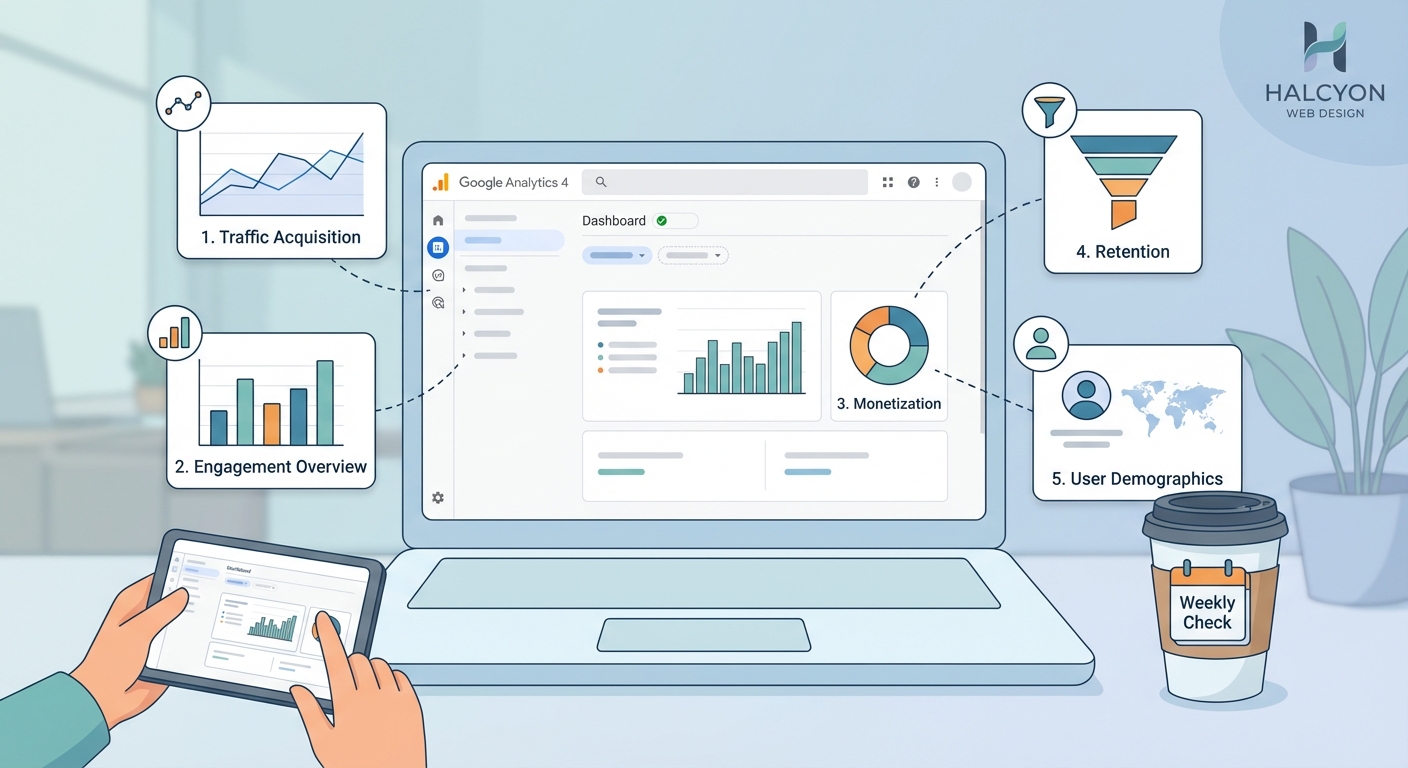
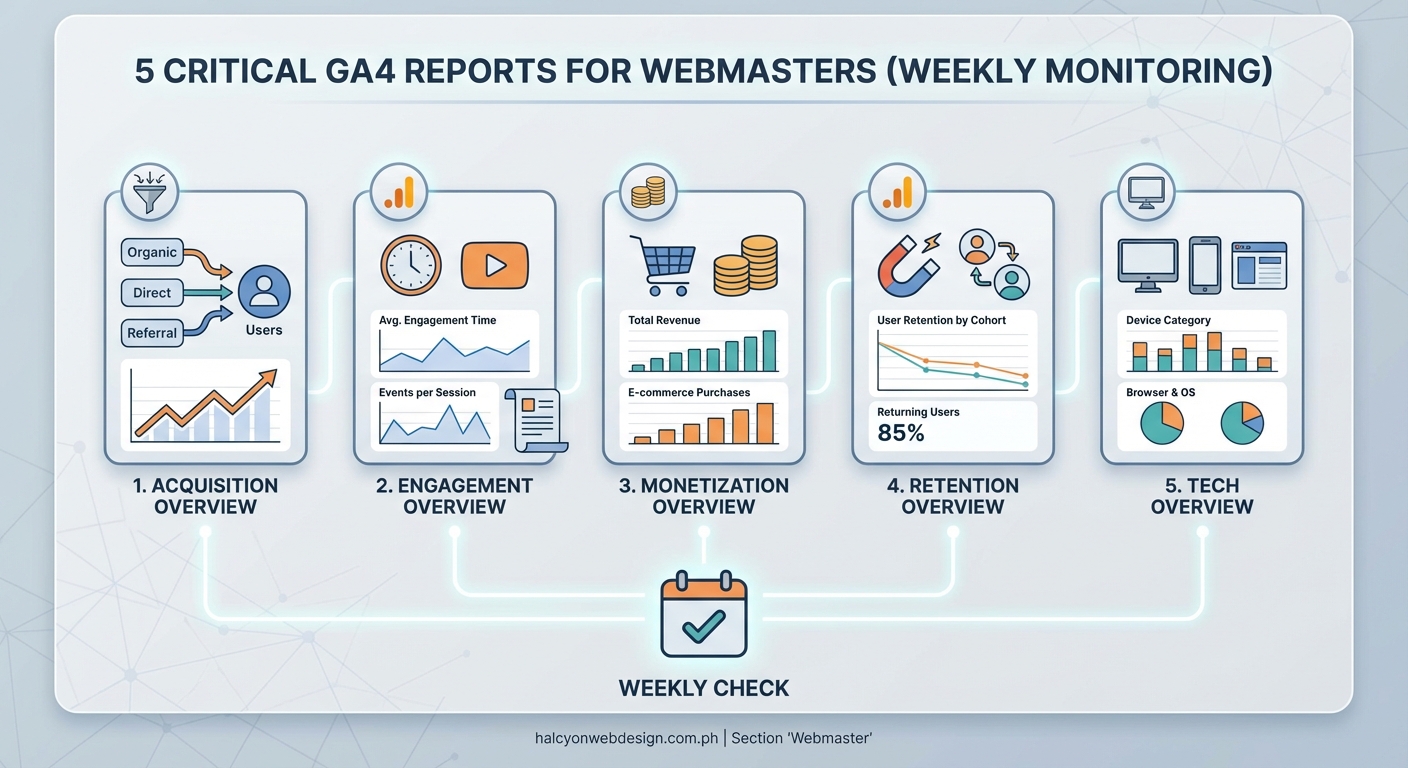
Google Analytics 4 offers dozens of reports, but only a handful truly matter for weekly monitoring. Focus on the Realtime report, Traffic Acquisition report, Engagement Overview, Pages and Screens report, and Conversions report to track performance effectively. These five reports give you the essential data needed to make informed decisions about your website without drowning in unnecessary metrics.
Understanding the GA4 Reporting Structure
GA4 organizes reports differently than Universal Analytics did. Instead of the familiar left sidebar with dozens of options, you’ll find a streamlined Reports section with fewer default views.
The new structure groups data into logical categories. You have Realtime, Life Cycle (which includes Acquisition, Engagement, Monetization, and Retention), and User attributes.
This reorganization actually makes sense once you understand the logic. GA4 focuses on the user journey rather than isolated sessions. Every interaction gets tracked as an event, which gives you more flexibility but requires a different mindset.
Many website owners make the mistake of trying to recreate their old Universal Analytics dashboard. That approach misses the point of GA4’s event-based model.
The Five Essential Reports for Weekly Monitoring
Not all reports deserve your weekly attention. Some metrics matter daily, others monthly, and many can be ignored entirely unless you’re troubleshooting a specific issue.
Here are the five reports you should check every week to stay on top of your website performance.
Realtime Report
The Realtime report shows what’s happening on your site right now. You can see how many users are currently active, which pages they’re viewing, and where they came from.
This report serves several practical purposes:
- Verify that tracking is working after making website changes
- Monitor traffic spikes from social media posts or email campaigns
- Check if your latest blog post is getting traction
- Identify technical issues before they affect too many visitors
You don’t need to stare at this report all day. A weekly check helps you spot patterns in when your audience is most active.
For example, if you publish content on Tuesday mornings and see immediate traffic, you know your email subscribers are engaged. If there’s no spike, something might be wrong with your distribution strategy.
Traffic Acquisition Report
The Traffic Acquisition report tells you where your visitors come from. This data is gold for understanding which marketing channels actually work.
You’ll see traffic broken down by source:
- Organic Search (people finding you through Google, Bing, etc.)
- Direct (typing your URL or using bookmarks)
- Referral (links from other websites)
- Social (Facebook, Twitter, LinkedIn, etc.)
- Email (clicks from email campaigns)
- Paid Search (Google Ads and other paid campaigns)
Look at this report weekly to spot trends. Maybe your organic search traffic is growing steadily, which means your SEO efforts are paying off. Or perhaps a guest post on another blog sent a surge of referral traffic.
The key metrics to watch are Users, Sessions, and Engagement Rate. Don’t obsess over total numbers. Focus on the percentage of engaged sessions, which tells you if the traffic quality is good.
Engagement Overview Report
The Engagement Overview gives you a snapshot of how people interact with your content. This report answers whether visitors actually care about what you’re publishing.
The Average Engagement Time metric replaced the old Bounce Rate. It measures how long users actively interact with your site. A higher number means people are reading, watching, or clicking around.
Event Count shows total interactions. In GA4, everything is an event: page views, button clicks, video plays, form submissions. The event count helps you understand overall activity levels.
Engaged Sessions per User tells you if people come back for more. A number above 1.0 means users are having multiple engaged sessions, which indicates strong content or product appeal.
Check this report weekly to ensure your engagement metrics aren’t declining. A sudden drop might indicate technical problems, poor content quality, or user experience issues.
Pages and Screens Report
The Pages and Screens report (found under Engagement > Pages and Screens) shows which content performs best. This is where you see individual page performance.
Sort by Views to find your most popular pages. These are your winners. Study what makes them successful and create more content like that.
Sort by Average Engagement Time to find pages where people spend the most time. Long engagement times on blog posts suggest valuable content. Short times might mean the content doesn’t match what people expected.
The table view makes comparison easy:
| Metric | What It Means | Action to Take |
|---|---|---|
| Views | Total page loads | Identify top performers |
| Users | Unique visitors per page | Find content with broad appeal |
| Average Engagement Time | Time spent actively engaged | Spot valuable content |
| Event Count | Total interactions | Measure interactivity |
Look for pages with high views but low engagement. These pages attract traffic but fail to hold attention. They need improvement.
Also check for pages with declining traffic week over week. Content decay happens. Older posts might need updates to stay relevant and maintain rankings.
Conversions Report
The Conversions report tracks the actions that matter most to your business. In GA4, you mark specific events as conversions to measure goal completions.
Common conversions include:
- Form submissions
- Newsletter signups
- Purchase completions
- File downloads
- Button clicks on important calls to action
You need to set up conversion tracking manually. GA4 doesn’t know what counts as a conversion for your business. Once configured, this report becomes your north star for measuring success.
Check your conversion numbers weekly. Are they trending up or down? Which traffic sources drive the most conversions? Which pages lead to the most goal completions?
Your conversion rate matters more than your traffic volume. A thousand visitors who do nothing are worth less than a hundred visitors who sign up for your service or buy your product.
If conversions drop suddenly, investigate immediately. The problem could be technical (broken forms), strategic (wrong traffic sources), or competitive (better offers from competitors).
How to Access These Reports Efficiently
Navigating to five different reports every week sounds tedious. GA4 offers features to streamline this process.
- Create a custom dashboard that displays key metrics from all five reports in one view
- Set up a Library of saved reports with your preferred filters and date ranges
- Use the Comparisons feature to automatically compare this week to last week
- Enable email reports to receive automated summaries without logging in
The Library feature is particularly useful. You can save customized versions of reports with specific filters applied. For example, save a Traffic Acquisition report filtered to only show organic search traffic.
Collections let you group related reports together. Create a “Weekly Review” collection containing your five essential reports for one-click access.
Common Mistakes When Reading GA4 Reports
Many website owners misinterpret GA4 data because they’re still thinking in Universal Analytics terms. Here are mistakes to avoid.
Comparing GA4 numbers directly to Universal Analytics numbers doesn’t work. The tracking methodologies differ fundamentally. GA4 counts users and events differently, so expect lower session counts and different metrics.
Ignoring the date range selector causes confusion. Always verify you’re looking at the right time period. The default view might not show the data you think it does.
Forgetting about data sampling can mislead you. When analyzing large date ranges or complex segments, GA4 sometimes uses sampled data instead of complete data. Look for the sampling indicator at the top of reports.
Not setting up proper filters means your data includes internal traffic. Exclude your own visits and those of your team members to get accurate visitor metrics.
Overlooking the engagement rate in favor of old metrics like bounce rate leads to misunderstanding. Engagement rate measures active interaction, which is more meaningful than whether someone left after one page.
Setting Up Your Weekly Review Routine
Consistency matters more than perfection. A regular weekly review beats sporadic deep analysis.
Pick the same day and time each week. Monday mornings work well for many people. You review the previous week’s performance and plan improvements.
Create a simple checklist:
- Check Realtime to verify tracking works
- Review Traffic Acquisition for source trends
- Examine Engagement Overview for interaction quality
- Analyze Pages and Screens for content performance
- Monitor Conversions for business goal progress
Document your findings in a simple spreadsheet or note. Track week-over-week changes in your key metrics. This historical record helps you spot seasonal patterns and long-term trends.
Set benchmarks based on your own data, not industry averages. Your website is unique. What matters is whether you’re improving compared to your past performance.
Making Decisions Based on Report Data
Data without action is just numbers. The point of monitoring these reports is to make better decisions.
When Traffic Acquisition shows one source performing well, double down on that channel. If organic search is growing, invest more in SEO. If referral traffic converts well, pursue more guest posting opportunities.
When Pages and Screens reveals high-performing content, create more content on similar topics. Update and expand successful posts to make them even better.
When the Engagement Overview shows declining metrics, investigate user experience issues. Test your site on different devices. Check page load speeds. Survey visitors about their experience.
When Conversions drop, examine the entire funnel. Where are people dropping off? Is the form too long? Is the value proposition unclear? Test different approaches and measure results.
Your Weekly Performance Rhythm
These five Google Analytics 4 reports give you everything needed to track website health and make smart improvements. You don’t need to become a data analyst or spend hours in reports every week.
Set aside 20 minutes each week to review these reports. Look for trends, spot problems early, and identify opportunities. Take notes on what you learn and commit to one improvement based on the data.
Your website will perform better when you pay attention to what the numbers tell you. Start this week, and you’ll be amazed at how much clearer your path forward becomes.